.svg)

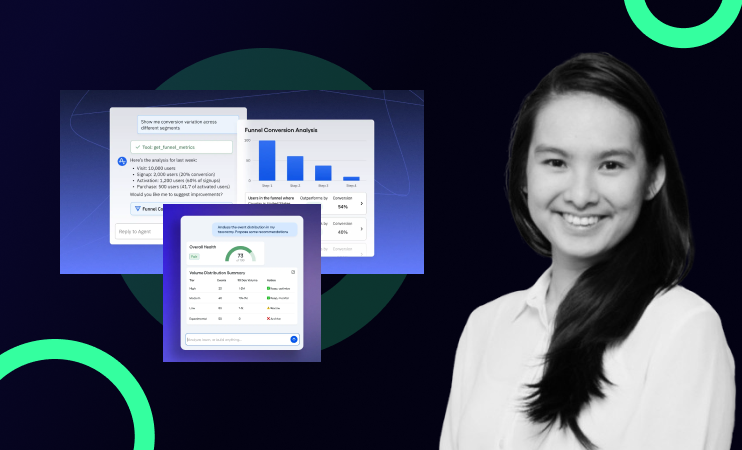
If you've ever wished your marketing data lived in the same place as your product data, Amplitude's Marketing Analytics hub is built for exactly that. In the short video below, Olivia, a Growth Consultant at Adasight tours every tab live in under 13 minutes: channels, ad performance, AI visibility, and more. This article breaks down what's inside and how to use it, but the video is the fastest way to see it click-by-click, so press play first if you're a watcher rather than a reader.
Your Guide to Marketing Data in Amplitude (Channels, Ads, Performance
Everything marketing lives in one tab
The first thing you notice is that marketing isn't scattered across exports and side tools,. it's all in the left-hand Marketing Analytics section. Traffic by channel, traffic by campaign, page engagement, ad performance, AI visibility, conversions, and Core Web Vitals each get their own view.
The practical takeaway from Olivia's walkthrough: most of what teams traditionally opened Google Analytics 4 for already lives here, and it's usable the moment your data starts flowing in. That means one workspace for "where did this user come from?" and "what did they do once they arrived?"
Channels and attribution
Channel grouping is the backbone of marketing analysis, and Amplitude gives you two layers. Out of the box, it groups traffic into categories like direct, external referral, and paid search. But the real power is custom channel grouping, you can define your own buckets, such as separating Meta paid from Meta organic, so social traffic and ad traffic don't get lumped together. We cover this in depth in Mastering Custom Channel Grouping in Amplitude.
On top of grouping, you choose an attribution model. Amplitude supports first-touch and last-touch attribution, and you can point your custom channel groupings at whichever model fits the question you're asking. If you're setting up channel tracking from scratch, our guide to tracking marketing channels in Amplitude with UTMs and attribution models walks through the configuration.
Traffic and engagement
Three views answer "who's coming in, and what are they doing?"
- Traffic by channel shows where visitors originate, along with sessions, bounce rate, session duration, and sessions per user.
- Traffic by campaign mirrors that but breaks it down by UTM campaign, so you can see which specific campaigns drive visits.
- Page engagement uses your on-site data to show which pages people actually view, broken down by page title, path, and URL — so you quickly learn which pages are most popular.
One prerequisite worth flagging: page engagement relies on page-view events. If you haven't instrumented those on your site yet, that's the first thing to set up.
Ad performance: from spend to ROAS
This is where Amplitude connects the money to the outcomes. You sync your advertising platforms as data sources like Google Ads, Meta, and LinkedIn, plus Bing, TikTok, and X (in beta), and Amplitude pulls in daily ad metrics. These arrive as their own events (not tied to a specific user): impressions, clicks, cost, and campaign name.
The value is in the stitching. Your ad platform supplies spend, impressions, and clicks; Amplitude supplies the on-site visit; and the two are married using the UTM parameters in your campaigns. Follow the chain: a user sees an ad (impression), clicks it (click), lands on your site (visit), and converts (conversion), all linked back to the same campaign.
From there, Amplitude calculates cost per click, cost of acquisition, and return on ad spend (ROAS) automatically. One thing not to skip: ROAS only works if your conversion or transaction events carry the revenue value, so make sure that's passed when you set up your events.
To connect a platform, head to Data → Sources, add an advertising source, and authorize access. Amplitude's documentation covers the per-platform setup, and there are a few Google Ads gotchas worth reading before you rely on the numbers.
AI visibility: how your brand shows up in ChatGPT, Claude, and Perplexity
One of Amplitude's newer additions tracks AI visibility, how often your brand is mentioned in answers from large language models like ChatGPT, Claude, and Perplexity, and how that compares to your competitors. You can see your share of mentions next to rival brands and inspect the prompts that tend to surface your product. As more buyers start their research inside AI assistants, this is an early read on whether you're showing up in those answers at all.
Core Web Vitals
Amplitude also surfaces Google Core Web Vitals, metrics like Largest Contentful Paint (how long the biggest element takes to render) and First Contentful Paint (how long until the first content appears). It's the site-performance data you'd normally check in GA4 or PageSpeed, now trended over time inside Amplitude so you can see whether your site is improving or slipping.
Conversions
Finally, the conversions view is your funnels. Define the steps that matter, in the video's example, uploading a file through to sharing it, and Amplitude shows how many users complete each step. Because everything sits in one place, you can break those funnels down by channel or campaign to see which sources don't just drive traffic, but actually convert.
How to get your marketing data into Amplitude
The hub is only as good as the data feeding it. A quick checklist:
- Instrument page-view events on your website.
- Connect your ad platforms under Data → Sources.
- Apply consistent UTM parameters across every campaign so attribution stitches correctly.
- Define your acquisition and conversion events, and pass revenue on transactions for ROAS.
Get those in place and the entire Marketing Analytics section populates on its own.
Watch the full walkthrough
Reading is one thing, seeing it is faster. In the video at the top of this post, Olivia clicks through every tab in Amplitude's Marketing Analytics hub in under 13 minutes, including the ad-platform sync, the AI visibility view, and the Google Ads details most people miss.
Ready to make Amplitude your marketing source of truth?
If you want help setting up channel grouping, connecting your ad platforms, or moving marketing reporting out of GA4 and into Amplitude, Adasight can help.
Frequently asked questions
Do I need to stop using Google Analytics 4 to use Amplitude's marketing analytics?
No. Amplitude's Marketing Analytics hub covers the same ground GA4 does — traffic, channels, campaigns, page engagement, and Core Web Vitals — so many teams consolidate. You can also run both. The advantage of Amplitude is that marketing data sits alongside product behavior, so you can follow a user from ad click all the way to in-product conversion.
How does Amplitude connect ad spend to conversions?
You sync your ad platforms (Google, Meta, LinkedIn, and more) to bring in daily ad metrics — spend, impressions, and clicks. Amplitude then matches those to on-site visits and conversions using the UTM parameters configured in your campaigns, and calculates cost per click, cost of acquisition, and ROAS automatically — as long as your conversion events carry revenue.
What is AI visibility in Amplitude?
AI visibility tracks how often your brand is mentioned in answers from AI assistants like ChatGPT, Claude, and Perplexity, and how that compares to your competitors. It also surfaces the prompts that tend to mention your product, helping you gauge your presence in AI-generated answers.
What do I need to set up before the Marketing Analytics hub is useful?
At minimum, make sure page-view events are tracked on your website, connect your advertising platforms as data sources, and apply consistent UTM parameters across campaigns. To get cost of acquisition and ROAS, also define your acquisition and conversion events and pass revenue on transactions.
Can I create custom channel groupings?
Yes. Alongside Amplitude's default channel grouping, you can build custom groupings — for example, separating Meta paid from Meta organic — and assign them to first-touch or last-touch attribution models to match the question you're answering.