.svg)

Most A/B testing mistakes are not random, they follow predictable patterns. Teams stop tests too early, trust p-values without checking confidence intervals, skip sample size calculations, and ship variants based on results that were never statistically reliable. This guide covers the A/B testing best practices that actually matter in 2026: the 5 concepts every experimenter needs to understand, the 6-point checklist for declaring a winner you can trust, and the process habits that separate teams with compounding programmes from teams running expensive guesses.
Running an A/B test is easy. Running one correctly is harder than most teams realise.
The gap between the two is not technical knowledge, it is process discipline. The teams producing reliable experiment results are not using more sophisticated tools or running more tests. They are following a structured process at every stage and refusing to shortcut the steps that feel inconvenient.
This guide covers everything that process requires.
Why Most A/B Tests Produce Unreliable Results
Before getting into best practices, it helps to understand why so many tests go wrong.
The most common failure mode is the false winner, a variant declared the winner before results are statistically reliable, shipped to production, and then discovered to have no real impact on the metrics it was supposed to move.
False winners almost always come from two sources: peeking at results before reaching the target sample size, and misreading statistical outputs by treating the p-value as the only number that matters. Both are process failures, not tool failures. And both are entirely preventable with the right habits in place.
Why most A/B tests fail is almost always a process problem rather than a hypothesis problem.
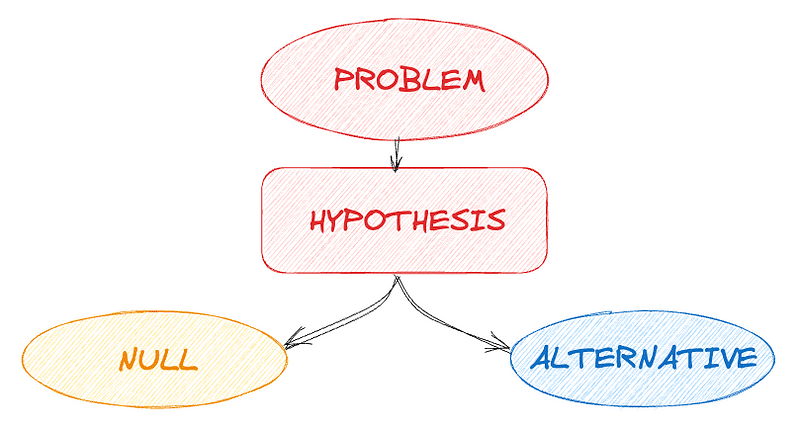
Best Practice 1: Always Start With a Documented Hypothesis
A hypothesis is not a description of what you are changing. It is a prediction of what will happen, why it will happen, and how you will measure it.
The formula: if we make this change, then this outcome will occur, because of this evidence.
A weak hypothesis: "changing the button color will increase conversion." No direction, no magnitude, no rationale.
A strong hypothesis: "if we change the CTA button from blue to green and increase its size by 20%, click-through rate will increase by at least 5%, because session replay shows users are not noticing the current button on mobile screens."
The strong version is testable, directional, and grounded in evidence. It also makes the result interpretable when you evaluate the data, you have a clear standard to measure against rather than deciding post-hoc what the result means.
Document the hypothesis before anything is built. If you are writing the hypothesis after the results come in, you are not running an experiment -- you are post-rationalising.
Best Practice 2: Calculate Sample Size Before You Launch
This is the step most teams skip, and it is the most common reason experiments produce unreliable results.
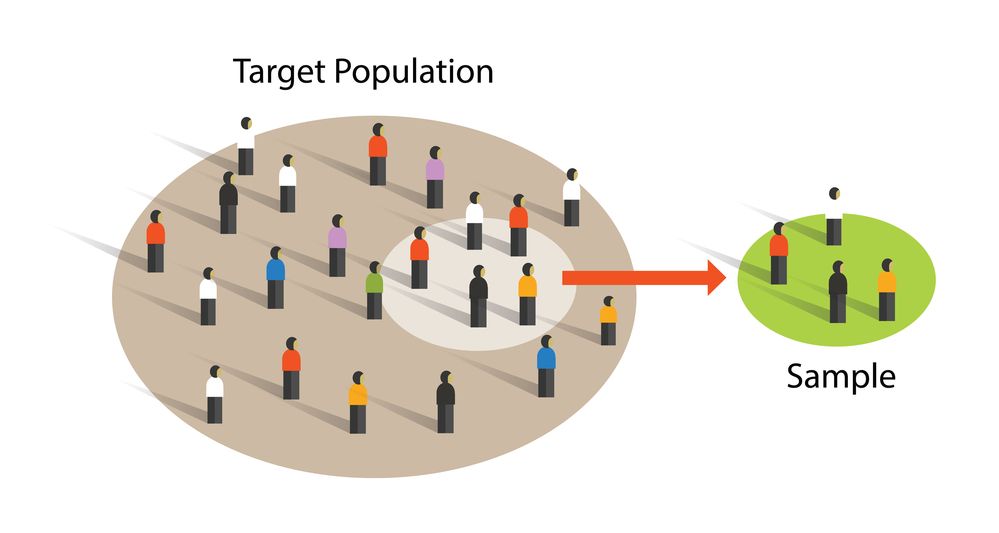
Sample size is the number of users each variant needs to be exposed to before your results are statistically reliable. You calculate it before the experiment starts using three inputs: your baseline conversion rate, your minimum detectable effect (the smallest lift worth detecting), and your desired statistical power (typically 80%).
The calculation tells you how many users you need and approximately how long the test needs to run. If that duration is three months and you only have two weeks of patience, the answer is not to run the test anyway. The answer is to raise your MDE or change your primary metric to one that reaches significance faster.
Skipping this step means you are making shipping decisions on data that may never have been statistically reliable, regardless of what the p-value shows when you decide to stop.
Best Practice 3: Understand the 5 Concepts That Determine Result Reliability
These are the five concepts every experimenter needs to understand before evaluating any result. Miss one and your result is not trustworthy.
Sample size and statistical power. Have you reached the target number of users per variant? Has the test run for at least one full business cycle? If not, do not evaluate: keep running.
P-value in context. A p-value below 0.05 means the result is unlikely to be due to chance. It does not tell you the direction or magnitude of the effect. Always read the p-value alongside the confidence interval and your MDE, never in isolation. A/B testing statistics explained covers exactly how these numbers work together.
Practical significance. A result can be statistically significant and practically meaningless. A 0.3% lift that costs significant engineering time to maintain is not a win. Before shipping, ask whether the magnitude of the improvement justifies the investment.
Variance reduction with CUPED. If your data has high variance, your results will be noisy and harder to interpret. CUPED (Controlled-experiment Using Pre-Experiment Data) reduces variance by incorporating historical user data into the analysis. Most modern experimentation tools support it. Enable it when you have good historical data and a meaningful proportion of returning users.
Sequential testing as a fix for peeking. If your team cannot stop checking results before the sample size is reached, sequential testing is the structured solution. It adjusts the significance threshold dynamically as data accumulates, allowing you to monitor results at any point without inflating your false positive rate. Enable it before the experiment starts, not after you have already been peeking.
Best Practice 4: Use the 6-Point Checklist Before Declaring a Winner
This checklist is the single most important habit a team can build. Every point needs to be satisfied before any shipping decision is made.
1. Hypothesis documented before the experiment started. Not written after the results came in. Pre-registration is what makes results interpretable and decisions defensible.
2. Target sample size reached. Check the number calculated before launch. If you have not hit it, keep running. No exceptions.
3. Full business cycles captured. Has the test run long enough to include all relevant user behaviour: weekdays, weekends, any cyclic patterns in your product or audience? A four-day test that misses weekend users is not a complete test.
4. Novelty effect ruled out. When users encounter a new variant, some engage simply because it is different. That effect fades. Running the test long enough to confirm the initial lift holds is the only way to rule out novelty as the cause.
5. Multiple hypothesis corrections applied. Running an A/B/n test with more than two variants? Apply the appropriate statistical corrections: Bonferroni or Benjamini-Hochberg. Without corrections, the probability of a false positive increases with every additional variant.
6. Segment consistency verified. Does the lift hold across new users and returning users? Mobile and desktop? An overall positive that is driven entirely by one segment is not a universal win, it is a segmentation decision that needs to be made before shipping to everyone.
All six points checked? You are ready to evaluate. But a result is still not a decision.
Best Practice 5: Ask Three Questions Before You Ship
Even after passing the checklist, three questions need clear answers before the variant ships.
Is the confidence interval entirely above your minimum detectable effect? If your MDE is 2% and your confidence interval ranges from -0.8% to 3.4%, the lower bound does not clear your threshold. The p-value might look fine. Extend the test.
Does the lift hold across key segments? An overall positive result driven by one segment requires a decision about whether to ship to all users or only to the segment where the lift is real.
Are your guardrail metrics clean? A variant that improves the primary metric but moves a guardrail metric negatively has not produced a net positive result. Always check both upstream and downstream guardrail metrics before shipping. How to read A/B test results covers the full evaluation process in detail.
If all three are yes: ship. Mixed results: keep running. All three no: document your learnings and build a more aggressive variant.
Best Practice 6: Document Every Result Regardless of Outcome
Documentation is what transforms a series of disconnected experiments into a compounding knowledge base.
Every experiment should be documented with the same structure: the hypothesis, the primary and secondary metric results, the time period, segment-level observations, the decision made, and the reason for that decision.
Winning experiments tell you what works for your users. Losing experiments tell you what does not, which is equally valuable and significantly underappreciated. A team that documents why a test lost is building institutional knowledge. A team that deletes the documentation and moves on is starting from scratch every sprint.
The 8-step A/B testing framework treats documentation as a mandatory final step, not an optional one. It is what makes learnings compound over time rather than evaporate.
Best Practice 7: Build a Cadence, Not a Campaign
The biggest difference between teams that run good experiments and teams that run great experimentation programmes is rhythm.
Great programmes have a consistent cadence: hypothesis backlog reviewed weekly, experiments launched on a regular cycle, results evaluated at a set frequency, and learnings fed back into the next round of hypothesis generation automatically. The programme runs like a system, not like a series of one-off projects.
This cadence is what makes experimentation compound. Each cycle builds on the last. Patterns emerge across experiments. The team gets faster, better calibrated, and more confident in their results, not because they became smarter but because the system they are running is designed to learn.
Building that system is the difference between experimentation as a tactic and experimentation as a competitive advantage.
Download the False Winners Playbook
The 5 concepts and 6-point checklist in this article are available as a structured playbook -- designed by Zain, Adasight's Experimentation Lead, for teams that need a practical reference to evaluate results correctly every time.
👉Download the free A/B Testing Playbook

Want to make your experimentation programme compound?
If your programme feels slow, manual, or like it is not building on itself -- the Experimentation Growth Engine automates hypothesis generation, prioritisation, and result evaluation so every experiment makes the next one smarter.
👉See the Experimentation Growth Engine
Want to talk through your experimentation setup?
FAQ
What are A/B testing best practices?
The core A/B testing best practices are: document a strong hypothesis before building anything, calculate sample size before launch, understand the 5 statistical concepts that determine result reliability (sample size, p-value, practical significance, CUPED, sequential testing), use a 6-point checklist before declaring a winner, ask three questions before shipping, document every result regardless of outcome, and build a consistent experimentation cadence.
How do you know when an A/B test is statistically significant?
A result is statistically significant when the p-value is below your significance threshold (typically 0.05) and the confidence interval sits entirely above zero. Both conditions need to be true -- a p-value below 0.05 with a confidence interval that crosses zero is not a reliable result. You also need to have reached your pre-calculated target sample size before evaluating.
What is the most common A/B testing mistake?
Stopping tests too early and declaring a winner before reaching the target sample size. This is called peeking, and it inflates false positive rates significantly. Early results are statistically unreliable and frequently reverse as more data accumulates. Sequential testing is the structured fix -- it allows continuous monitoring without inflating false positive rates.
What is CUPED in A/B testing?
CUPED stands for Controlled-experiment Using Pre-Experiment Data. It is a variance reduction technique that uses historical user data to reduce noise in experiment results, making them more reliable with smaller sample sizes. Most modern experimentation tools support it. It is most effective when you have good historical data and a meaningful proportion of returning users.
How many variants should an A/B test have?
Start with two variants -- control and one treatment -- for your first tests. Adding more variants (A/B/n testing) requires proportionally more traffic to reach statistical significance in a reasonable timeframe, and requires statistical corrections to account for the increased probability of false positives. Only add variants when you have sufficient traffic and a clear reason to test multiple directions simultaneously.
What should you do when an A/B test fails?
Document the hypothesis, the result, and why you believe the test failed. A failed test is not wasted effort -- it eliminates a direction and points toward a different hypothesis. Teams that document failed experiments build a knowledge base of what does not work for their users, which is as valuable as knowing what does. Review the failure for signal: did a specific segment respond differently? Did a guardrail metric move? The failure often contains the seed of the next strong hypothesis.


