.svg)

A/B testing in marketing means running controlled experiments on your campaigns, landing pages, emails, and ads to find out what actually drives more clicks, signups, and revenue instead of guessing. It is one of the highest-ROI activities a marketing team can invest in because every test produces either a winning improvement or a learning that informs the next one. This guide covers what A/B testing means in a marketing context, how to run it correctly, real examples of what to test, and the mistakes that turn good tests into wasted effort.
Most marketing decisions are made on intuition dressed up as strategy.
The headline feels compelling. The CTA button color matches the brand. The email subject line tested well with the team. But none of that is evidence. Evidence comes from showing two versions to real users and measuring which one produces more of the outcome you care about.
That is A/B testing. And in marketing, it is the difference between a team that optimises based on data and a team that optimises based on whoever is most confident in the room.
What Is A/B Testing in Marketing?
A/B testing in marketing is the practice of creating two versions of a marketing asset: a landing page, an email, an ad, a CTA button, showing each version to a different segment of your audience simultaneously, and measuring which version produces better results against a defined metric.
Version A is the control, what you currently have. Version B is the variant, the change you want to test. Traffic or send volume is split between the two, results are measured over a sufficient period, and the version that performs better on your primary metric is declared the winner.
The key word is simultaneously. Testing version A this week and version B next week does not produce reliable results because external factors like seasonality, news events, algorithm changes, can affect performance independently of the change you made. True A/B testing runs both versions at the same time to the same audience.
What Can You A/B Test in Marketing?
Almost anything in your marketing operation can be tested. The most impactful areas are:
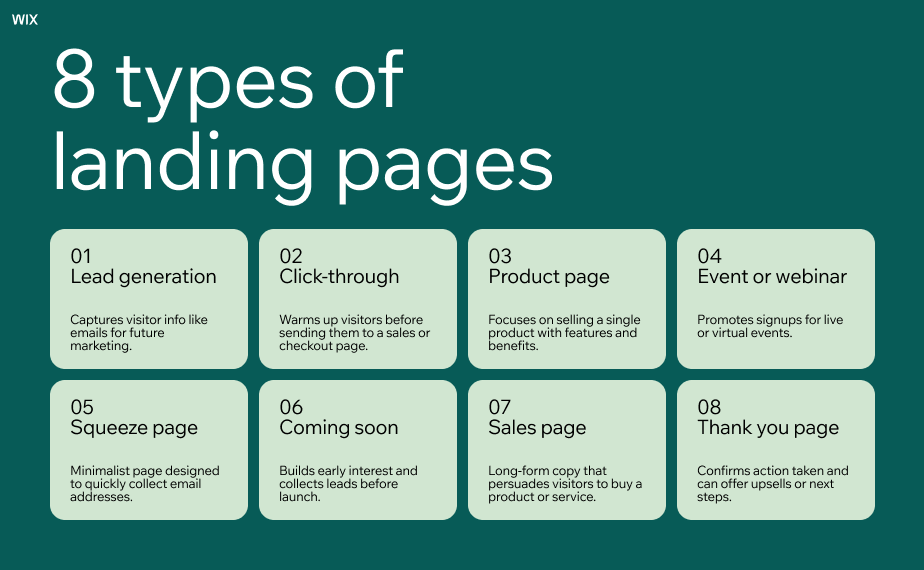
Landing pages. Headline copy, hero image, CTA button text and color, social proof placement, form length, page layout, value proposition framing. Landing pages are the highest-leverage testing area for most marketing teams because small conversion rate improvements compound directly into more leads and revenue at the same acquisition cost.
Email campaigns. Subject lines, preview text, sender name, send time, email length, CTA placement, personalisation tokens, imagery versus plain text. Email is one of the easiest channels to test because send volume gives you rapid sample sizes and results are available within 24 to 48 hours.
Paid ads. Headlines, descriptions, images, video thumbnails, CTAs, audience targeting, bidding strategies. Ad testing is particularly valuable because you are paying for every impression -- finding the variant that converts better directly reduces your cost per acquisition.
Onboarding flows. Welcome email sequences, first-session prompts, feature introduction copy, progress indicators, activation triggers. Onboarding tests often produce the highest retention impact because improvements here compound across every user who ever signs up.
Pricing pages. Price anchoring, plan names, feature emphasis, social proof placement, CTA copy. Pricing page tests require more caution because the stakes are higher, but the potential impact on conversion and revenue is significant.
Real-World A/B Testing Examples in Marketing
Example 1: Landing page headline test
A SaaS company is running paid search campaigns driving traffic to a trial signup page. The current headline is "The Analytics Platform Built for Growth Teams." The variant tests "See Exactly Where Your Users Drop Off -- and Fix It."
The variant leads with a specific outcome rather than a product description. After running the test for two weeks with sufficient traffic, the variant produces a 23% higher trial signup rate. The improvement is statistically significant and the confidence interval sits entirely above zero. The variant ships as the new default.
Example 2: Email subject line test
A marketing team sends a weekly product newsletter to 40,000 subscribers. They test two subject lines: "Your Weekly Product Update" versus "3 things your competitors figured out this week."
The second subject line generates a 34% higher open rate. The curiosity-driven, competitive framing outperforms the generic descriptive version. This insight informs subject line strategy across all future campaigns, not just this one send.
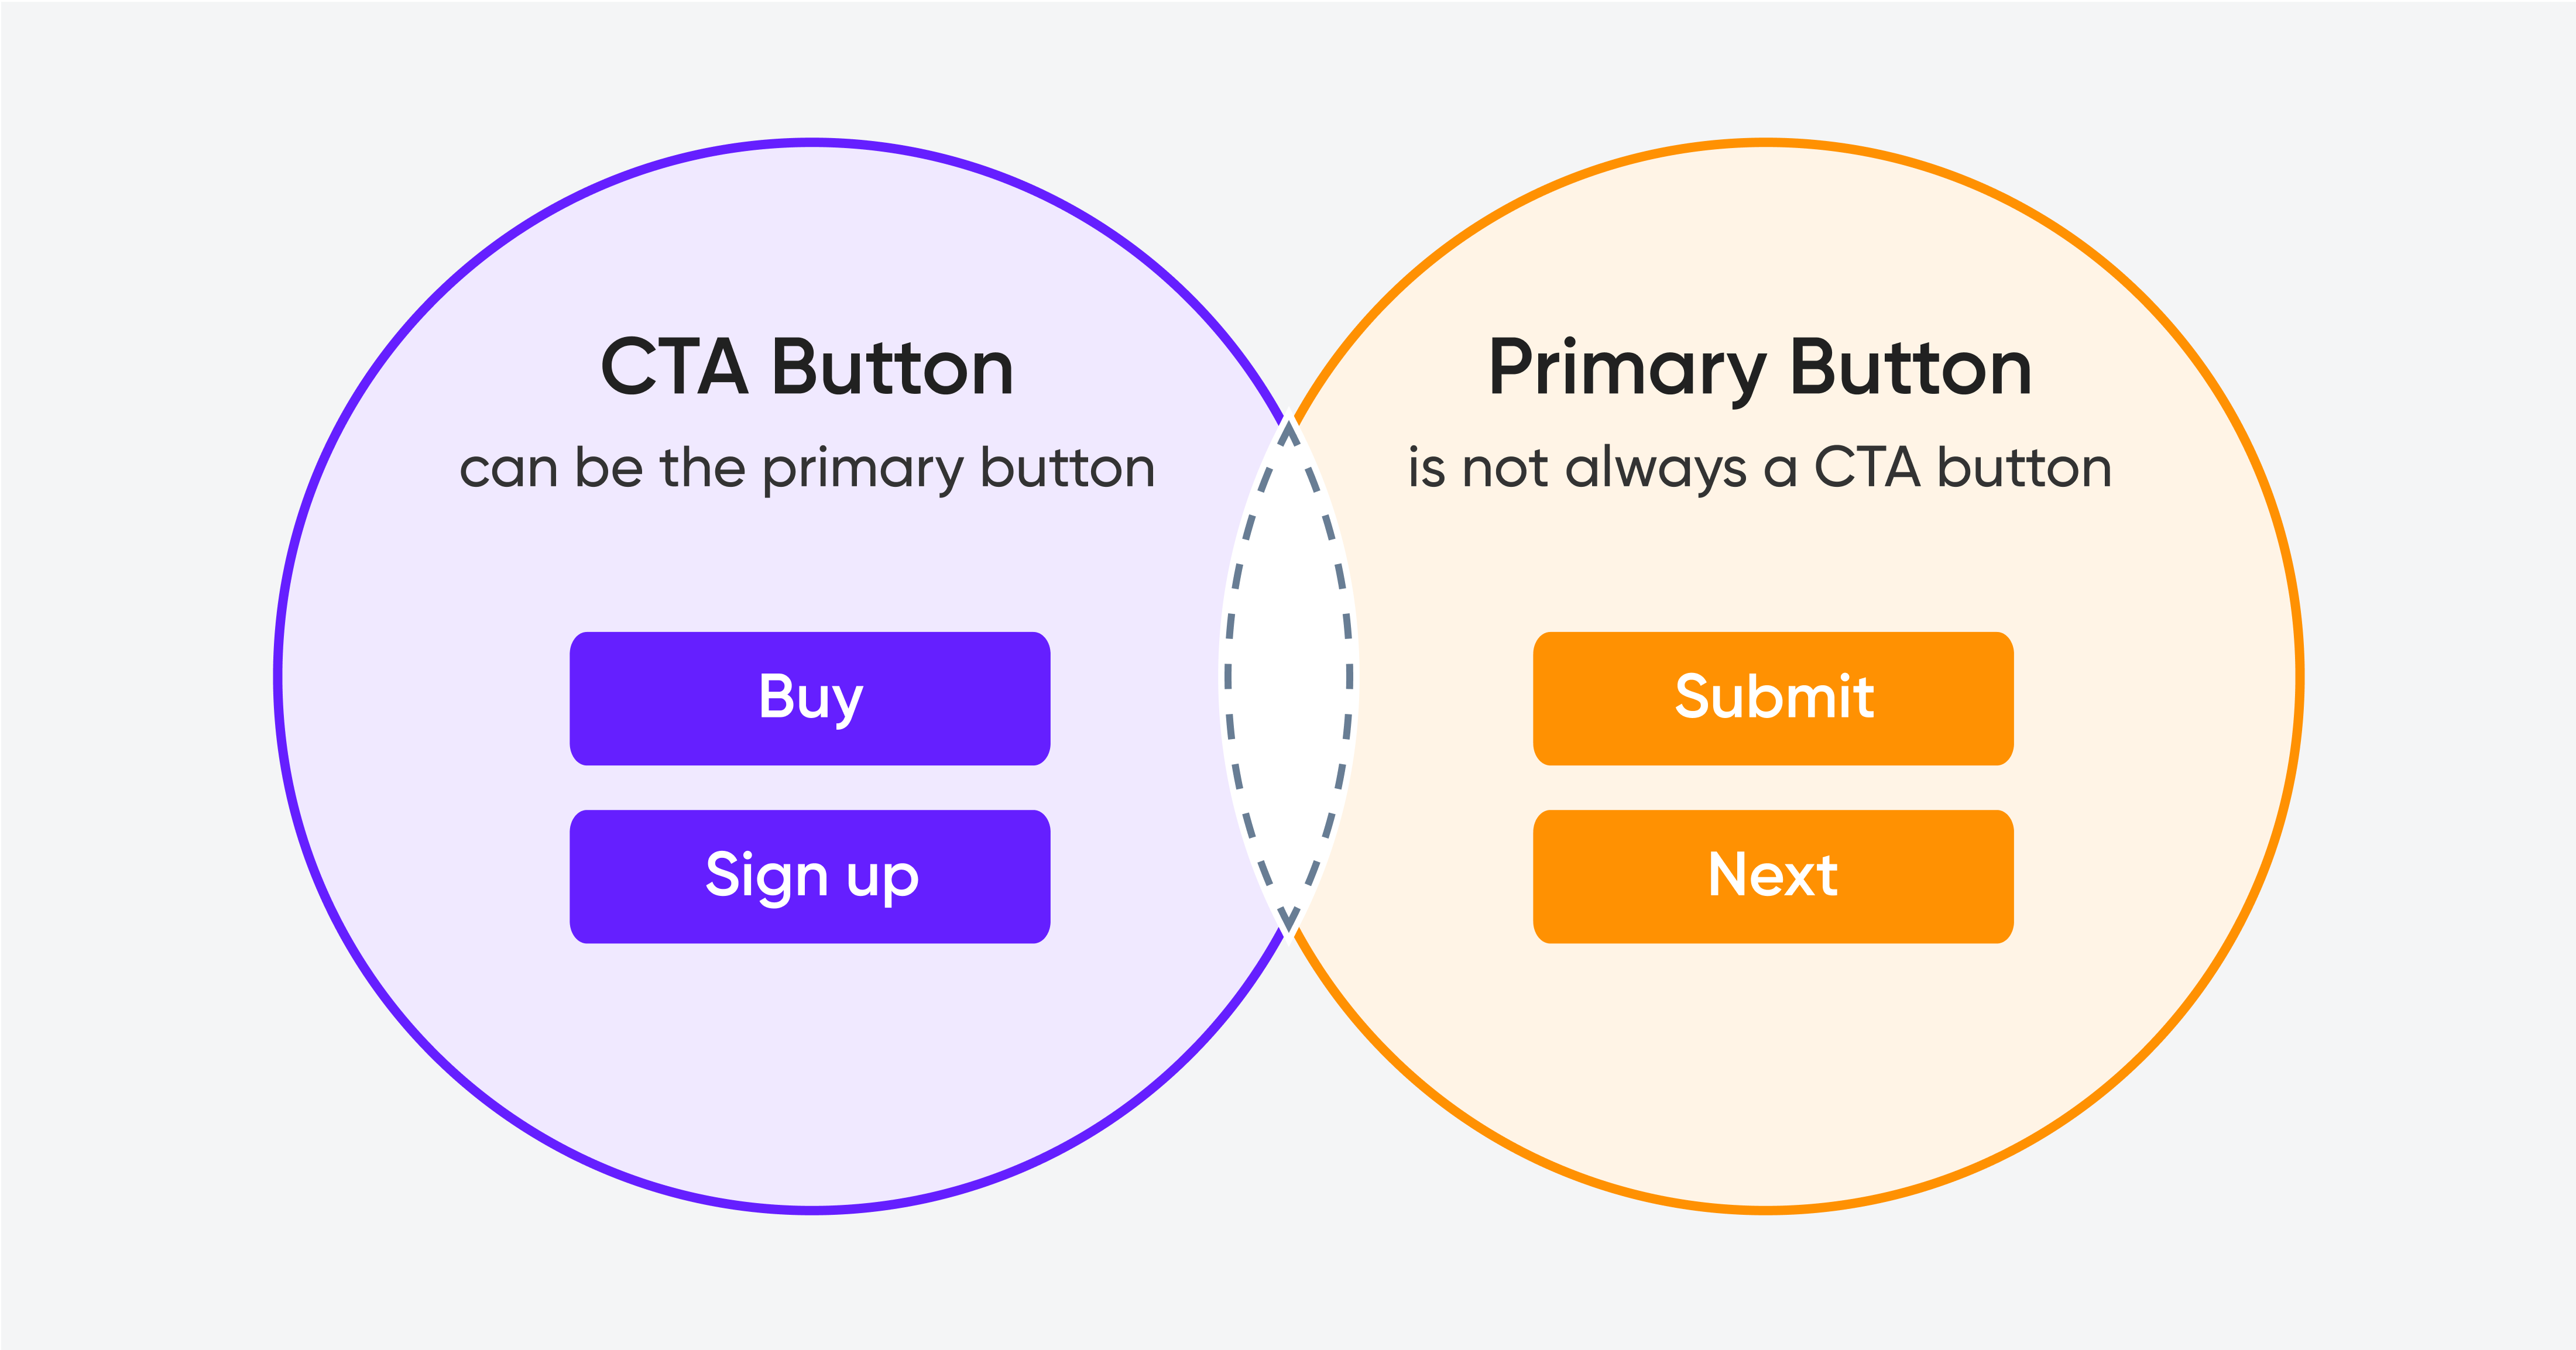
Example 3: CTA button copy test
An e-commerce brand tests two versions of their product page CTA: "Add to Cart" versus "Get Yours Now." The second version produces a 12% higher add-to-cart rate across mobile users. Desktop users show no significant difference. The team ships the variant for mobile and keeps the control for desktop -- a segmented rollout based on where the lift was real.
This example illustrates an important principle: always check whether results hold across segments before shipping to everyone. A result that looks positive overall can be driven entirely by one user group while hurting another. The guide to avoiding false winners covers exactly why segment-level analysis is non-negotiable before any shipping decision.
How to Run an A/B Test in Marketing: The Core Process
Before anything else, choose the right tool for what you are testing. A landing page test needs a different tool than an email test or an in-product experiment, and picking the wrong one creates friction at every stage. The best A/B testing tools in 2026 covers the full comparison so you can pick the right fit before you start.
1. Identify what to test
Start with data, not intuition. Look at your analytics to find where users are dropping off: high bounce rates on landing pages, low open rates on email sequences, high cost per click on specific ad sets. Session replay and heatmap data shows you where users are confused or hesitating. Customer feedback surfaces the language and objections that matter most to your audience.
The highest-impact tests almost always come from real signals in your data, not creative brainstorming sessions.
2. Write a strong hypothesis
A hypothesis defines what you are changing, what you expect to happen, and why. The formula: if we make this change, then this outcome will occur, because of this evidence.
Weak: "changing the CTA color will increase clicks." Strong: "if we change the CTA button from grey to high-contrast orange, click-through rate will increase by at least 8%, because heatmap data shows users are not focusing on the current button position on mobile screens."
The strong version is testable, directional, and grounded in evidence. Document it before you build anything.
3. Calculate your sample size
This is the step most marketing teams skip and the most common reason tests produce unreliable results. Sample size determines how many users each variant needs to be exposed to before your results are statistically reliable.
For email tests, this means minimum send volume per variant. For landing page tests, it means minimum visitor count per variant. For ad tests, it means minimum impressions or clicks per variant.
Calculate your required sample size before launching: using your baseline conversion rate, your minimum detectable effect (the smallest improvement worth detecting), and your desired statistical power. The 8-step A/B testing framework covers sample size calculation in detail.
4. Run the test correctly
Split traffic or send volume evenly between control and variant. Run both versions simultaneously. Do not stop the test early because one version looks better, early results are statistically unreliable and frequently reverse as more data accumulates. Run the test until you have reached your pre-calculated sample size and captured at least one full business cycle.
5. Evaluate results properly
Check statistical significance (p-value below your threshold), check the confidence interval (it should sit entirely above zero for a positive directional result), check whether the lift holds across key segments, and verify that guardrail metrics have not moved negatively.
A result is not a decision. Walk through the evaluation checklist before shipping anything.
6. Document and iterate
Whether the test wins or loses, document it. What you tested, what happened, what decision you made, and why. This documentation becomes the foundation for your next round of hypotheses, and the compound knowledge base that separates a mature marketing experimentation programme from a series of one-off tests.
The Most Common A/B Testing Mistakes in Marketing
Testing too many things at once. Changing the headline, the image, and the CTA button simultaneously makes it impossible to know which change drove the result. Test one variable at a time.
Stopping tests too early. The result looks positive on day three and the team calls it. By day fourteen the lift has disappeared. Run tests to their full sample size: no exceptions.
Choosing the wrong primary metric. Testing a landing page and measuring page views instead of form completions. Testing an email and measuring opens instead of clicks or conversions. The primary metric must be the one directly connected to the business outcome you care about.
Not segmenting results. An overall positive result that is driven by one device type, one acquisition channel, or one user segment is not a universal win. Always check performance across your most important segments before deciding to ship.
Ignoring losing tests. A test that loses is not a failure -- it is information. A variant that hurts conversion tells you something important about your users. Document it and use it to build a stronger hypothesis next time.
Just getting started with A/B testing?
The A/B Test Design Guide covers the complete 8-step process: hypothesis writing, sample size calculation, metric selection, and result documentation, so you can run your first marketing experiment correctly from day one.
👉Download the free A/B Test Design Guide

Already running tests but not sure your results are reliable?
The False Winners Playbook covers the 5 concepts and 6-point checklist your team needs to declare winners you can actually trust -- every time.
👉Download the False Winners Playbook

Want to make your marketing experimentation programme compound?
If your programme feels slow, manual, or like it is not building on itself: the Experimentation Growth Engine automates hypothesis generation, prioritisation, and result evaluation so every test makes the next one smarter.
👉See the Experimentation Growth Engine
FAQ
What is A/B testing in marketing?
A/B testing in marketing is running controlled experiments on marketing assets -- landing pages, emails, ads, CTAs -- by showing two versions to different segments of your audience simultaneously and measuring which produces better results. It replaces intuition-based decisions with evidence-based ones, making every test either a winning improvement or a learning that informs the next one.
What can you A/B test in marketing?
You can test almost any marketing asset: landing page headlines and layouts, email subject lines and send times, ad copy and creative, CTA button text and color, pricing page structure, onboarding email sequences, and form length. The highest-impact tests target the elements with the biggest influence on your primary conversion metric.
How long should a marketing A/B test run?
Long enough to reach your pre-calculated sample size and capture at least one full business cycle -- typically a minimum of two weeks for most marketing tests. Stopping early because results look positive is the most common cause of false winners. Calculate the required duration before launching based on your baseline conversion rate and minimum detectable effect.
What is a good sample size for an A/B test?
Sample size depends on your baseline conversion rate, the minimum improvement you want to detect, and your desired statistical power. Lower baseline conversion rates and smaller minimum detectable effects require larger sample sizes. Use a sample size calculator with your actual numbers before launching -- do not estimate.
How do you know if an A/B test result is statistically significant?
A result is statistically significant when the p-value is below your significance threshold (typically 0.05) and the confidence interval sits entirely above zero. Both need to be true. A p-value below 0.05 with a confidence interval that crosses zero is not a reliable result -- extend the test.
What is the difference between A/B testing and multivariate testing?
A/B testing tests one variable at a time -- control versus one variant. Multivariate testing tests multiple variables simultaneously to find the best combination. Multivariate testing requires significantly more traffic to reach statistical significance and is more complex to analyse. For most marketing teams, A/B testing one variable at a time is the right starting point.
.png)


