.svg)

What Is ContentSquare? A Complete Guide for Product and Marketing Teams
ContentSquare is a digital experience analytics platform that shows you how users interact with your website or app where they click, how far they scroll, where they rage click, and which page elements drive or kill conversions. Unlike product analytics tools that track what users do, ContentSquare focuses on how and why they behave the way they do. This guide explains what ContentSquare is, what it does, who it's for, and how it fits into a modern analytics stack.
Most analytics tools tell you what happened.
Your conversion rate dropped 12% last week. Bounce rate on the pricing page is up. Users are dropping off at step three of the onboarding flow.
But none of that tells you why. And without the why, you're guessing at solutions.
That's the gap ContentSquare is built to close.
What is ContentSquare?
ContentSquare is a digital experience analytics platform. It captures how users physically interact with your website or app:, their mouse movements, scroll behavior, clicks, taps, and hesitations, and turns that into visual data you can act on.
Where traditional analytics tools show you numbers and funnels, ContentSquare shows you behavior. You can watch exactly where users click on a page, see which sections they scroll past without engaging, identify elements that cause frustration, and understand which parts of your page are actually driving conversions.
It's used primarily by e-commerce, retail, financial services, and enterprise SaaS teams who need to optimize high-traffic digital experiences and can't afford to leave conversion improvements on the table.

What ContentSquare actually does: the core features
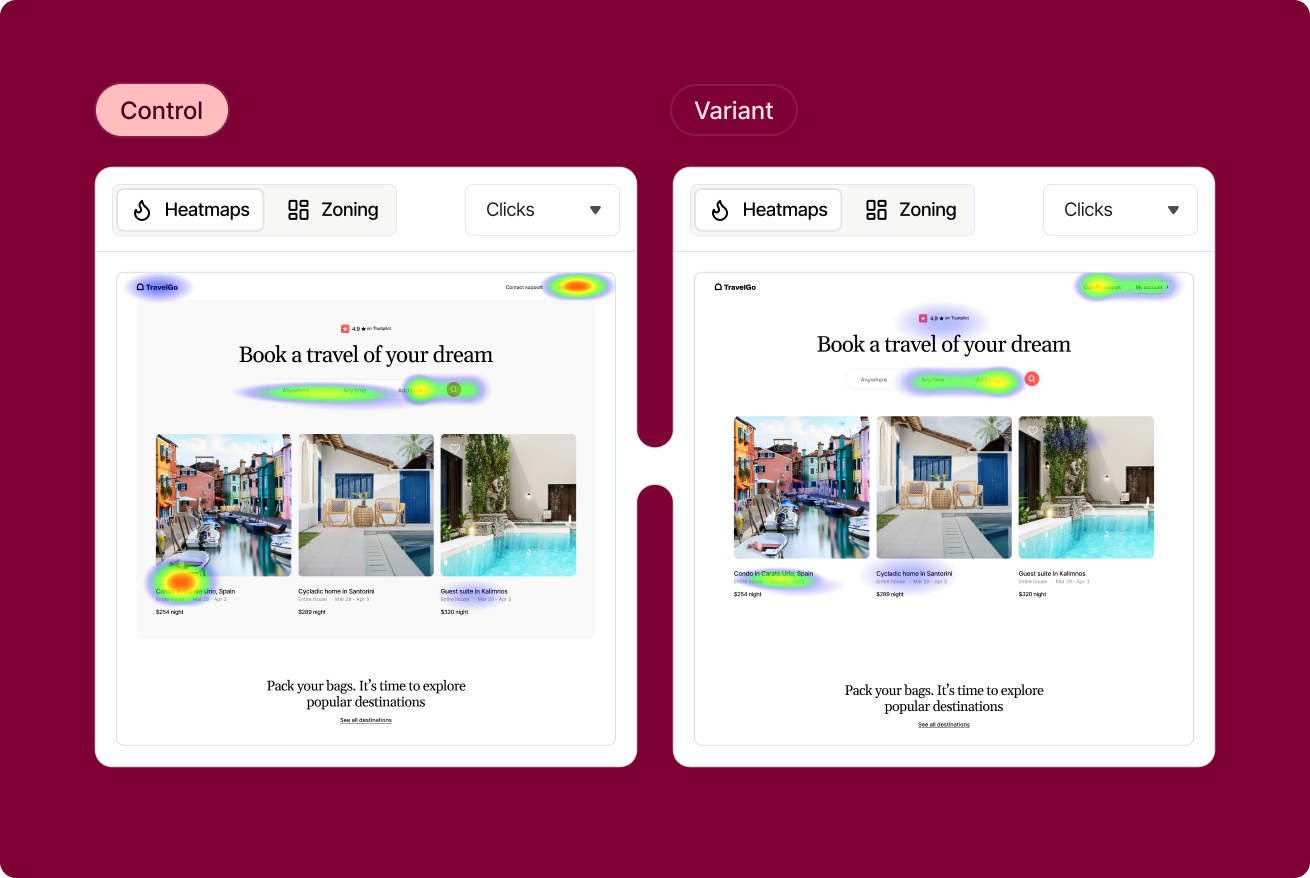
Heatmaps and zone-based analytics
ContentSquare's heatmaps show you where users click, move, and spend time on any page. But what makes it more powerful than basic heatmap tools is zone-based analytics. It breaks your page into individual zones (hero section, CTA button, product image, navigation) and shows you the exposure rate, click rate, and revenue attribution for each one.
This means you can see not just where people click, but which zones are actually earning their place on the page and which are taking up space without driving results.
Session replays
ContentSquare records individual user sessions so you can watch exactly how a real user moved through your site. This is particularly useful for diagnosing friction. You can filter for sessions where users rage-clicked, encountered errors, or abandoned at a specific step, and watch exactly what happened.
The difference between ContentSquare's session replay and simpler tools is the ability to connect session behavior to quantitative outcomes, so you're not just watching random sessions, you're watching the sessions that explain a specific conversion or retention problem.
Frustration scoring and rage click detection
ContentSquare automatically identifies frustration signals like rage clicks, dead clicks, error clicks, and hesitation patterns, and scores pages based on how much friction users are experiencing. This surfaces problems you'd never find by looking at conversion data alone.
Journey analysis
ContentSquare maps the actual paths users take through your site, not the paths you designed, but the ones they actually follow. This reveals unexpected navigation patterns, common exit points, and the routes that most often lead to conversion.
AI-powered insights
ContentSquare's AI layer, called CS AI, automatically surfaces anomalies, flags pages with significant experience problems, and generates recommendations without you having to dig through every report manually. It's similar in concept to what Amplitude is building with its Dashboard Agent, but applied specifically to experience data rather than product event data.
Who ContentSquare is for
ContentSquare is built for teams that own high-traffic digital experiences and need to optimize them continuously.
E-commerce and retail teams use it to understand why users aren't converting on product pages, where checkout friction lives, and which content drives purchase intent. Financial services teams use it to reduce drop-off in complex application flows and compliance-heavy journeys. Enterprise SaaS teams use it to optimize marketing sites and self-serve onboarding flows.
It's an enterprise product, pricing reflects that. Teams with lower traffic volumes or early-stage products are typically better served by lighter tools like Microsoft Clarity or Hotjar before graduating to ContentSquare.
How ContentSquare fits into your analytics stack
This is where most teams get confused. ContentSquare is not a replacement for your product analytics tool. It's a complement to it.
Your product analytics tool like Amplitude, Mixpanel, GA4 tells you what your users are doing at the event level. Conversion rates, retention curves, feature adoption, funnel drop-off. These are the numbers that drive decisions.
ContentSquare tells you why those numbers look the way they do. If your Amplitude dashboards are missing the "why" behind user behavior, ContentSquare is often the tool that fills that gap, giving you the visual, behavioral context that explains what your quantitative data is showing.
A practical example: Amplitude shows you that 60% of users drop off on your pricing page. ContentSquare shows you that most of those users scroll to the pricing table, hesitate, and then exit, and that the table's mobile layout is causing rage clicks on the plan comparison toggle. Now you know what to fix.
The two tools answer different questions. Used together, they give you a complete picture.
ContentSquare vs session replay in Amplitude
If you're already using Amplitude's Session Replay, you might wonder whether ContentSquare adds anything on top of it.
Amplitude Session Replay is tightly integrated with your event data, you can jump from a funnel chart directly into the sessions of users who dropped off at that step, with full event context. That integration is genuinely powerful and is the right starting point for most product teams.
ContentSquare goes deeper on the experience layer:, heatmaps, zone analytics, frustration scoring, and AI-powered experience recommendations are more developed than what Amplitude's session replay currently offers. For teams running high-volume conversion optimization programs, ContentSquare's dedicated focus on experience data makes it the stronger tool for that specific use case.
How ContentSquare compares to other analytics tools
ContentSquare sits in a different category from tools like Amplitude vs Adobe Analytics. Those are product and marketing analytics platforms focused on event data, attribution, and behavioral funnels. ContentSquare is specifically an experience analytics platform, competing most directly with Hotjar, FullStory, and Microsoft Clarity at different price and capability tiers.
The short version: ContentSquare is the enterprise-grade option in the experience analytics space, with the most sophisticated zone analytics, AI layer, and revenue attribution of any tool in its category.
Want to build an analytics stack that actually drives decisions?
Combining experience analytics with product analytics is how the best teams close the gap between data and action. If you want to talk through how ContentSquare, Amplitude, and your existing stack fit together, book a call.
Book a 30-minute call with Gregor →
FAQ
What is ContentSquare used for?
ContentSquare is used to understand how users physically interact with websites and apps — where they click, scroll, hesitate, and rage click. It helps product, marketing, and e-commerce teams identify friction points, optimize page layouts, and improve conversion rates using visual behavioral data.
Is ContentSquare the same as a heatmap tool?
ContentSquare includes heatmaps but goes significantly further. Its zone-based analytics, frustration scoring, journey analysis, session replays, and AI-powered recommendations make it a full digital experience analytics platform rather than just a heatmap tool.
How is ContentSquare different from Amplitude?
ContentSquare and Amplitude serve different purposes and are typically used together. Amplitude tracks what users do at the event level — conversion rates, retention, feature adoption. ContentSquare shows how users behave visually — where they click, what frustrates them, which page elements drive conversions. One gives you the numbers; the other explains why the numbers look that way.
Who are ContentSquare's main competitors?
ContentSquare's main competitors in the digital experience analytics space are Hotjar, FullStory, and Microsoft Clarity. ContentSquare is the enterprise-tier option, with more advanced zone analytics, AI features, and revenue attribution than its competitors.
Is ContentSquare suitable for small businesses?
ContentSquare is primarily built for enterprise and mid-market teams with high traffic volumes. Smaller teams or early-stage products are typically better served starting with a lighter tool like Microsoft Clarity (free) or Hotjar before moving to ContentSquare as their optimization program matures.

.png)