Data Analytics Foundation for Growth Teams
Build the data foundation your whole company runs on.
From scattered tools to AI-ready dashboards — a 6-month engagement that delivers a validated data foundation, KPI-scoped dashboards across two teams, and a cleaned data model ready for AI.


Who This Is For
You're in the right place if any of these sound familiar.

Data scattered across disconnected tools
Your data lives across multiple tools with no unified view — pulling a single metric means stitching together exports.

Teams disagree on the numbers
Different teams report different numbers for the same question, and nobody agrees on what's actually true.

No dedicated data team in place
You don't have an in-house data team and need someone to build the foundation right from the start.

Ready to act on AI — once the data's clean
You're thinking about AI use cases and need a clean, structured data model before you can act on them.
Why it matters
Generic dashboards don't move companies.
A data foundation built around the KPIs your teams actually care about does — and it's the prerequisite for anything you want to do with AI.
Scoped to real business questions
Your team owns the foundation
Scope of Work
Three build areas covered over 24 weeks — from collaborative KPI definition through dashboards, analyses, and an AI-ready cleaned data model.
KPI Definition & Architecture
- Collaborative KPI definition with up to 2 teams (up to 20 KPIs — 10 per team)
- Full data landscape audit across five dimensions — quality, consistency, ownership, usage, AI readiness
- Data source mapping and architecture blueprint — what to connect, how, and in what order
Implementation & Integration Testing
- Your team implements the architecture; we guide, validate, and troubleshoot throughout
- Every integration tested as it goes live, catching errors before they compound
- Issue log maintained and resolved before dashboard build begins
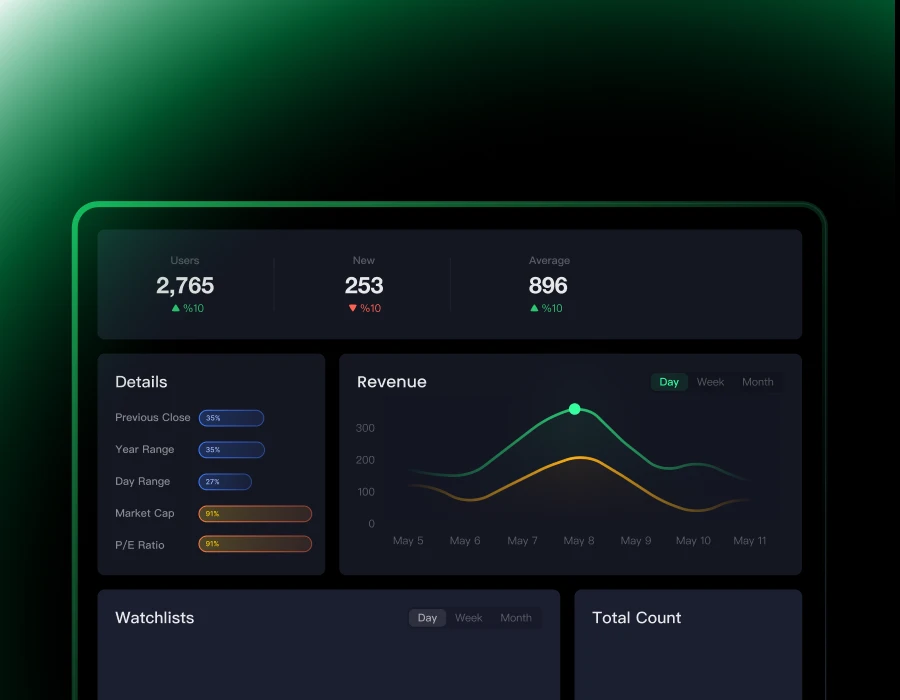
Dashboards, Analyses & Data Cleaning
- 2 KPI-scoped dashboards — one per team, built to answer their defined KPIs
- 3 deep-dive analyses tied to the questions defined at the start
- Full data cleaning pass — naming corrected, duplicates removed, nulls handled, model documented
Every engagement delivers
- Architecture blueprint and KPI framework — up to 20 KPIs across 2 teams
- Validated integrations and pipelines · 2 dashboards (one per team)
- 3 analyses with findings and recommendations
- Cleaned, documented data model — ready to plug into AI tools
Roadmap
Six months, three phases — predictable rhythm, no black box.

KPI definition & architecture
- Collaborative KPI definition sessions with both teams
- Full data landscape audit and source mapping
- Architecture blueprint with a prioritised implementation plan

Implementation + visualisation planning
- Your team implements the architecture — we guide and validate each integration
- Issue log maintained, errors caught before they compound
- Week 9 visualisation planning: which dashboard answers which team's KPIs

Dashboards, analyses & handover
- Dashboards 1 & 2 built for each team's KPIs (Weeks 9–16)
- Analyses 1–3 run in parallel with fix cycles for any surfaced gaps
- Full data cleaning pass + final delivery session with both teams (Week 24)
Customer Success Stories


Frequently Asked Questions
Everything you need to know about our tech-enabled services.
Serving multiple teams from the same foundation is one of the core value propositions of this tier. Capping at 2 teams and 20 KPIs keeps the engagement focused — every deliverable answers a real question defined at the start.
Your team implements everything — all infrastructure is owned by you. We design, guide, and validate.
We identify this in Weeks 1–2 during the mapping phase and either find an alternative source or adjust the KPI. We don't wait until dashboard build to surface data gaps.
At the end of this engagement, your cleaned data model can be fed directly into AI tools — LLMs, analytics platforms, or automation workflows — without additional preprocessing.
Book a Discovery Call
Ready to take your product and marketing performance to the next level? Let’s start a conversation about transforming your data into actionable strategies.