.svg)

10 Signs Your Analytics Setup Can't Be Trusted
Bad data doesn't announce itself. Your dashboards still load, the charts still have numbers, and everyone keeps making decisions off them — right up until someone asks a hard question and the whole thing wobbles. The uncomfortable reality: CMOs estimate that roughly 45% of the data behind their marketing decisions is incomplete, inaccurate, or outdated (Adverity, 2025), and not one rated their data more than 75% reliable. Here are ten concrete signs your setup is in that half — and what each one is really telling you.
The short version: Your analytics setup probably can't be trusted if you see signs like these: numbers that don't reconcile across tools, "direct" traffic ballooning, no single agreed definition of key metrics, no owned tracking plan, inconsistent or missing events, inflated user counts from fragmented identity, and impossible funnel numbers. The common thread is a shaky data foundation — tracking that grew ad hoc without ownership, conventions, or validation. It matters because every downstream report, budget decision, and AI-driven insight inherits those errors. The fix is one agreed definition of each metric, a documented and owned tracking plan, and validated events.
1. Your numbers don't reconcile across tools
GA4 says one thing, your ad platforms say another, and your backend revenue says a third — and no two agree. Some variance is normal (tools measure differently), but large, unexplained gaps mean at least one source is wrong and you don't know which. If you can't reconcile your tools to a defensible range, you can't trust any of them.
2. "Direct" traffic is ballooning
When a big and growing share of traffic lands in "direct," it's rarely people typing your URL — it's traffic whose real source got lost. Broken UTM tagging, stripped referrers, and misattribution dump sessions into "direct," which quietly hides where your demand actually comes from and distorts every channel report built on top of it.
3. There's no single definition of a key metric
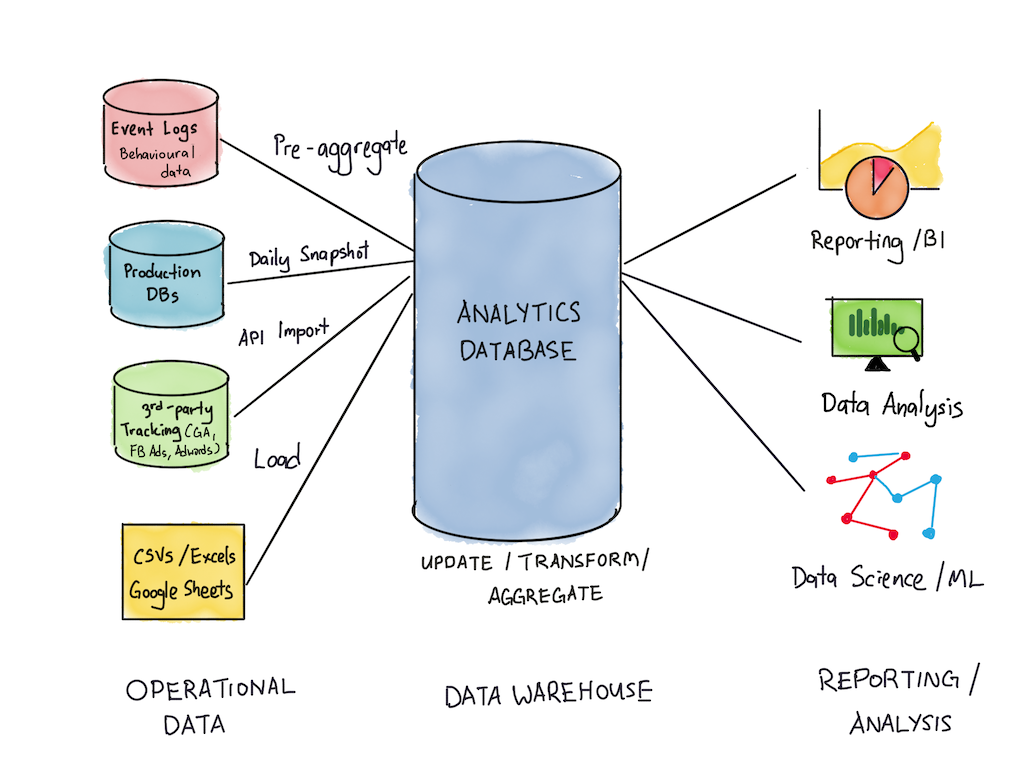
Ask three people what "an active user" or "revenue" means and you get three answers. When each team counts a core metric its own way, every cross-team conversation becomes a translation problem, and no report can be trusted because none of them mean the same thing. One agreed definition per key metric is foundational — it's why building a single source of truth for your data matters more than any dashboard.
4. No one owns the tracking plan (or there isn't one)
Clean tracking is the highest-leverage, lowest-glamour work in the building — so it falls between marketing, analytics, and engineering and gets deferred indefinitely. If you can't name the person who owns your tracking plan, or there's no tracking plan at all, your events were added ad hoc, and everything downstream inherits that chaos.
5. Event names are inconsistent or duplicated
checkout_complete, CheckoutComplete, and purchase all firing for the same action is a classic tell. Without naming conventions, the same behavior gets logged under different names (and different behaviors under the same one), so any analysis silently under- or over-counts. Disciplined event tracking is what prevents this — and it's hard to retrofit once the mess exists.
6. Events fire inconsistently, or not at all
An event that fires twice, fires on the wrong trigger, or was never implemented correctly poisons every metric built from it. Client-side and server-side events landing out of sync is a common culprit. If you've never validated that your key events actually fire the way you think, assume some don't — it's one of the most common configuration mistakes that quietly corrupts reporting.
7. Your user counts look inflated
If your tool shows far more "users" than you know you have, your identity model is likely fragmenting — one real person splitting into several as their anonymous and logged-in sessions fail to stitch together. It's especially common with non-email logins. Fragmented identity distorts every user-level metric downstream, from retention to LTV, so it's worth fixing identity resolution early.
8. Your funnels show impossible numbers
A funnel returning zero conversions when you know people are converting — or a step showing more than 100% — isn't a tool limitation. It usually means the funnel has too many steps, a required event isn't firing, or events are mis-sequenced. Impossible funnel numbers are a loud signal that the events underneath them can't be trusted.
9. You can't trace a number back to its source
Pick a figure on a key dashboard and ask how it's calculated. If no one can explain the lineage — which events, which definitions, which filters produced it — then no one can vouch for it either. Untraceable numbers are unverifiable numbers, and unverifiable numbers shouldn't be driving budget.
10. Your team argues about the data instead of acting on it
The most human sign of all: meetings that get stuck debating whose number is right instead of what to do next. When people don't trust the data, they fall back on opinion and seniority — and every decision slows down. If "which number is correct?" is a recurring agenda item, that is the diagnosis.
Why this is expensive, especially now
Untrustworthy analytics isn't a reporting nuisance; it's a decision problem. Every flawed number leads to a misallocated budget, a misjudged test, or a wrong strategic call — and the damage compounds because bad inputs flow into every downstream report. AI makes it worse, not better: pointed at a broken foundation, AI just produces flawed insights faster and at greater scale. You can't automate your way out of bad data; you fix the foundation first, then everything built on it becomes trustworthy.
See where your data is actually leaking
If several of these signs feel familiar, the honest next step is to find out how deep it goes. Adasight's free Growth Gap Assessment scores your maturity across data, experimentation, and AI in about three minutes — no email needed to see your result — and pinpoints your single biggest gap.
And if the answer is your data foundation (as it often is), that's exactly what our Data Foundation engagement fixes: one definition of every metric and tracking you'd trust enough to cut spend on.
Frequently asked questions
How do I know if my analytics data can be trusted?
Look for warning signs: numbers that don't reconcile across tools, ballooning "direct" traffic, no single definition of key metrics, no owned tracking plan, inconsistent or missing events, inflated user counts, and impossible funnel numbers. If several are present, your data foundation is shaky and your reports can't be fully trusted.
Why don't my analytics numbers match across tools?
Because each tool measures differently and attributes differently, some variance is expected — but large, unexplained gaps usually mean broken tracking, inconsistent metric definitions, or misattribution. If you can't reconcile your sources to a defensible range, at least one is wrong.
What causes bad analytics data?
Most often, tracking that grew ad hoc: no tracking plan or owner, inconsistent event naming, events that fire incorrectly or not at all, and fragmented user identity. Because this foundational work falls between teams, it gets deferred — and every downstream metric inherits the flaws.
Does AI fix bad data?
No — it amplifies it. AI applied to a flawed foundation produces inaccurate insights faster and at larger scale, because the output can only be as good as the input. Fixing data quality has to come before layering AI on top, or you just scale the errors.
How do you fix untrustworthy analytics?
Start by establishing one agreed definition for each key metric, then create and assign ownership of a documented tracking plan, standardize event naming, and validate that your critical events actually fire correctly. A gap assessment or data audit will tell you which of these to prioritize first.

.png)