.svg)

North Star Metric Explained: What It Is and How to Choose Yours
Most teams track dozens of metrics and still can't answer a simple question: if everything else were noise, which single number would tell us whether we're winning? That number is your North Star metric — the one measure that best captures the value your product delivers to customers. Get it right and it aligns an entire company; get it wrong and you can hit your target while the business quietly stalls.
The short version: A North Star metric is the single metric that best captures the core value your product delivers to its customers — the one number a whole team can rally around. A good one is value-based (it goes up when customers get real value), leading rather than lagging (it predicts future revenue instead of just reporting the past), and measurable and actionable. It's not a vanity metric like total signups, and usually not revenue itself — revenue is the result of delivering value, while the North Star measures the value that produces it. Beneath the North Star sit "input metrics": the levers, like activation and engagement, that teams actually move to push it up.
What is a North Star metric?
A North Star metric (NSM) is the one metric a company chooses to represent the value it creates for customers — the number that, if it keeps climbing, means the product is genuinely working. Its job is alignment: instead of marketing chasing signups, product chasing feature usage, and sales chasing deals in separate directions, everyone orients around a single shared measure of value. It's the metric you'd keep if you had to delete every other chart on the dashboard.
Crucially, the North Star sits at a specific altitude. Above it are the ultimate business outcomes (revenue, profit); below it are the many operational metrics teams touch daily. The North Star is the bridge — high enough to matter to the whole company, specific enough to actually steer by.
What makes a good North Star metric
Not every big number qualifies. A strong North Star has three properties:
- It's value-based. It rises when customers get real value from your product, not merely when they show up. That's what keeps the whole company pointed at customer success rather than internal activity.
- It's a leading indicator, not a lagging one. A good North Star predicts future revenue rather than just reporting past results. If you steer only by lagging outcomes, you're always reacting too late — the North Star should move before the money does. (This is exactly the leading-vs-lagging distinction that separates metrics you can act on from metrics that only confirm the past.)
- It's measurable and actionable. The team must be able to track it reliably and actually influence it through their work. A number nobody can move isn't a guiding star — it's just decoration.
What a North Star metric is not
Two common mistakes:
It's not a vanity metric. Total registered users, page views, or downloads all go up and to the right almost regardless of whether your product is any good — so they can't tell you whether you're delivering value. A North Star has to be something that only improves when customers actually benefit.
It's usually not revenue itself. This one surprises people. Revenue is the outcome of delivering value, not the value itself — and optimizing revenue directly can push teams toward short-term extraction (aggressive upsells, dark patterns) that quietly erodes the customer experience. The better move is to pick the North Star that drives revenue — the delivered value — and let the revenue follow. Revenue is how you win; the North Star is about how the customer wins.
Commonly cited examples
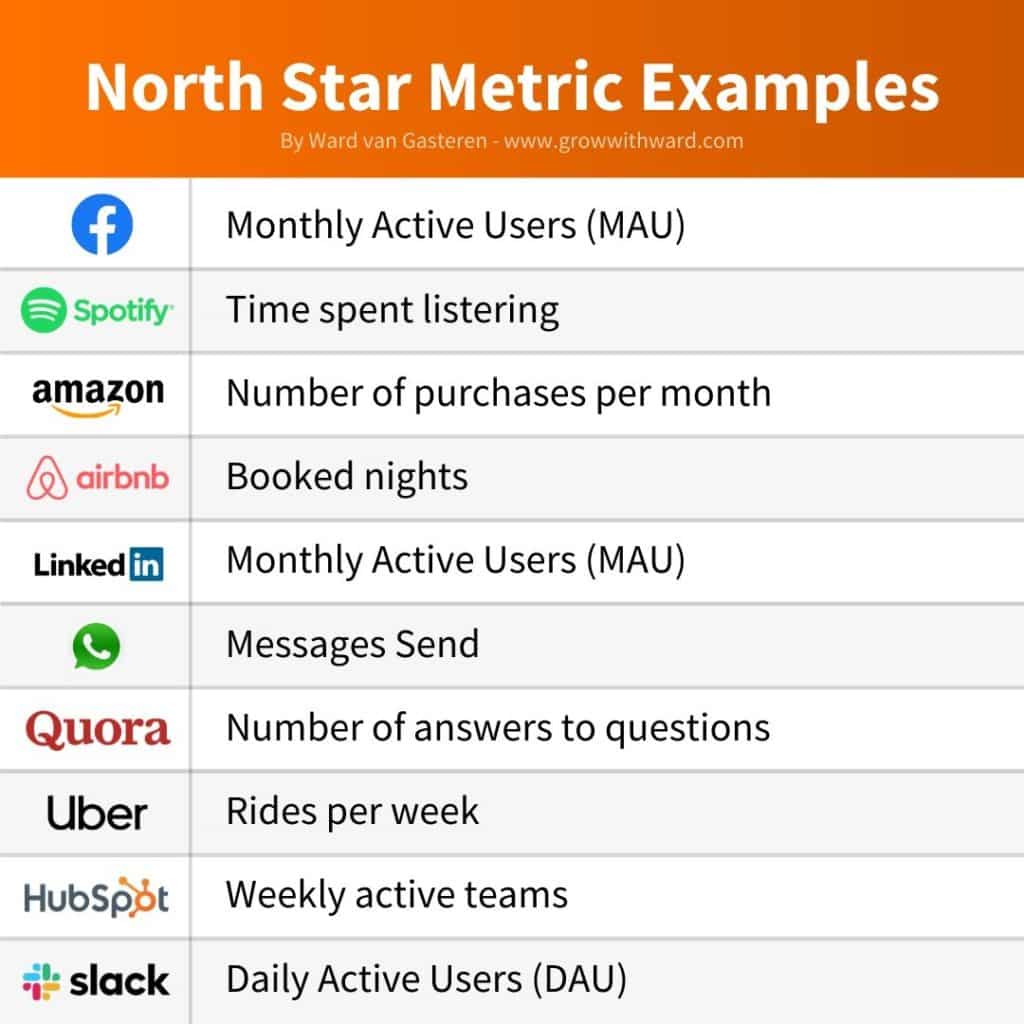
The classic examples make the "value delivered" idea concrete (these are widely cited in the product community, and illustrate the thinking rather than serving as audited benchmarks):
- A stay-booking marketplace: nights booked — value happens when a guest actually books and stays, not when someone browses.
- A music-streaming service: time spent listening — the metric moves only when people get real value from the product.
- A messaging/collaboration tool: messages sent or active usage — signaling the product is genuinely part of a team's workflow.
Notice the pattern: each captures a moment of real value exchange, not a surface-level count. That's the test to apply to your own.
Input metrics: the levers beneath the star
A North Star is deliberately high-level, which raises an obvious question: how does a team actually move it? Through its input metrics — the handful of contributing levers that roll up into the North Star. If your North Star is weekly active usage, its inputs might be new-user activation, engagement frequency and stickiness, and retention. Teams don't wake up and "improve the North Star" directly — they improve an input, which moves the star. This is what makes the framework operational rather than aspirational: the North Star aligns direction, and the input metrics give each team something concrete to own.
How to choose your North Star metric
A practical way to land on yours:
- Define the core value you deliver. Finish the sentence: "Customers get value from us when they ___." That action is the seed of your North Star.
- Find the metric that best captures that moment. Translate the value moment into something countable — the closest measurable proxy for "the customer got what they came for."
- Pressure-test it against the three criteria. Is it value-based? Does it lead rather than lag? Can the team measure and move it? If it fails any of these, keep looking.
- Validate that it predicts business success. Check the data: do customers who drive your candidate North Star up actually retain and monetize better over time? A real North Star correlates with the business outcomes you care about — if it doesn't, it's the wrong star.
- Map its input metrics. Identify the two to four levers beneath it so every team has a concrete way to contribute.
Get the foundation right first
A North Star only works if you can measure it — and its inputs — reliably. If your tracking is shaky, you'll be steering the whole company by a number you can't trust. Our Data Foundation engagement gets your events and metrics set up so your North Star and its input metrics reflect reality.
Frequently asked questions
What is a North Star metric?
It's the single metric that best captures the core value your product delivers to customers — the one number a whole company can align around. If it's steadily rising, it means the product is genuinely delivering value, which in turn drives long-term growth.
Should revenue be your North Star metric?
Usually not. Revenue is the result of delivering value, and optimizing it directly can push teams toward short-term tactics that hurt the customer experience. A better North Star measures the value that produces revenue — so revenue follows as the outcome rather than being the target itself.
What's the difference between a North Star metric and a KPI?
A North Star is the single, company-wide metric representing your core value; KPIs are the broader set of performance indicators different teams track. In practice, many of your KPIs become the "input metrics" that roll up into and drive the North Star.
What are input metrics?
Input metrics are the handful of contributing levers a team can directly influence — like activation, engagement, and retention — that combine to move the North Star. Teams improve inputs rather than trying to move the high-level North Star directly.
How do you choose a North Star metric?
Define the core value you deliver, find the metric that best captures that value moment, and test it against three criteria: it should be value-based, a leading indicator, and measurable/actionable. Then validate with data that it predicts retention and revenue, and map the input metrics beneath it.